Jason Lempkin is well known for having said that a startup’s continued success becomes inevitable upon reaching $10m in ARR.
What a lot of people don’t know is that he added a giant asterisk to this because it turns out you can still easily fail past $10m if you don’t have one very important thing in place.
We’ll dig into exactly what that is in a moment.
Inevitability in SaaS comes around $10m in ARR [...] once you hit $10m in ARR or so, you cannot be killed by anything. That’s the power of compounding SaaS revenue.
Jason Lempkin
Over the years Jason’s quote and the $10m ARR milestone have come to have a great deal of significance to investors and founders.
It’s no wonder either. It’s a nice simple rule and it appears to be true. Yet as is so often the case, the reality is not quite this simple.
I thought at that time [inevitability at around $10m in ARR] was true for every startup in SaaS, but it turns out it’s really true more for a large but material subset of SaaS companies.
Older/Wiser Jason Lempkin
SaaS Compounds (Sometimes)
The power of SaaS is that it compounds. The thinking goes that once you hit $10m in ARR you are compounding such a large number that even if the annual rate isn’t high you are going to inevitably grow at a significant pace for the foreseeable future. Except that’s not always true.
As it turns out, reaching $10m in ARR correlates with success but is not causal. In order to continue to compound revenue and for your success to be “inevitable” you have to have your 50+20 revenue dialed in.
So what is 50+20 revenue? It means that you are getting 50% of your revenue from word-of-mouth (brand “I heard of you” and other zero-cost lead sources) and that you are getting 20% from expansion revenue (i.e. your net churn is negative.)
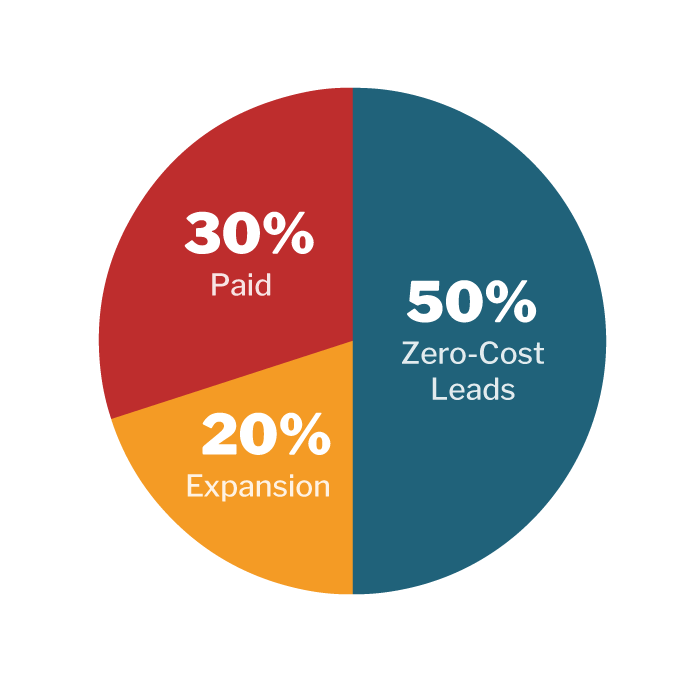
In other words, your revenue is actually compounding on itself. Each additional dollar of revenue you earn should drive the next dollar of revenue but this only happens if your existing customers are bringing you new customers and spending more money with you over time.
When you hit that large ARR milestone of $10m it is going to be customer happiness that fuels your ability to compound revenue into the future. It’s the combination of 50+20 revenue (aka compounding revenue) working on top of a large ARR base that makes success inevitable.
If you think about it as a financial investment account:
- Your total ARR is the balance of your investment account.
- Your 50+20 (or whatever your numbers are) is your interest rate.
- Your new ARR is how much you contribute monthly.
A company that hits $10m ARR but doesn’t hit 50+20 is like an investment account that has a high balance but a near-0 or even negative APR.
For this reason, by the time you hit $10m ARR (and ideally way before this point) you should be getting:
- 50% of your revenue from word-of-mouth, brand “I heard of you”, and other zero-cost lead sources.
- 20% of your revenue from expansion revenue (net negative churn.)
Around the $10m ARR mark, the primary growth lever becomes 50+20 revenue because that is your mechanism for compounding.
All the best-of-breed companies hit 50+20 by $10m ARR. It’s what makes them “best-of-breed.” Scaling is pretty easy because:
- Your blended CAC is super low.
- Your LTV is super high.
It’s this combination that makes you unstoppable. You are super capital efficient and growing your leads and revenue like a monster.
Don’t pat yourself on your back because of your ‘pretty good’ Magic Number. Hooray, you pay back your sales and marketing costs in 13 months. But if you don’t have 50+20, you’ll hemorrhage cash at $10m ARR.
Jason Lempkin
To really understand why 50+20 revenue is so important, it’s helpful to really understand the mathematical impact of 2 things:
- Churn.
- The law of shitty click-throughs.
Churn Compounds (Always)
We just established that the power of SaaS is that it compounds. It’s a slog to get going but even a small growth rate compounding on a large number is a force to be reckoned with. The power of compounding and all that.
The problem is that churn also compounds but it’s a sneaky bastard because it doesn’t hit critical mass until you are well past thinking your SaaS growth is at critical mass.
You oftentimes don’t see it until it’s too late because it appears so benign while your ARR is still in the single-digit millions. But depending on your level of churn, it’s at around this point that it metastasizes into a force so large that it begins to negate all the new revenue you bring in.
Here is an example of what 5% monthly churn looks like if you are adding 100 new customers per month. Now 5% churn is extreme but I use it to illustrate its impact over a short period of time.
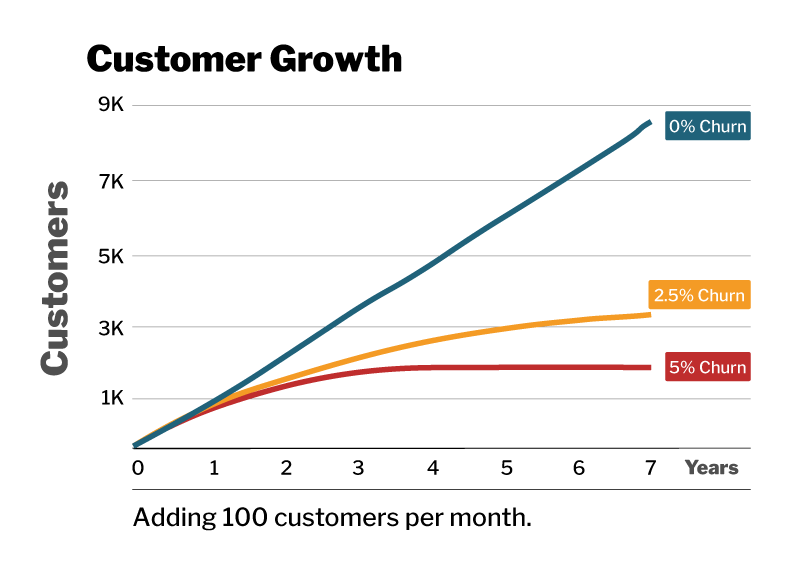
Keep in mind that if you have low churn you also have a product that generates a lot of customer happiness and so the number of new customers you add per month will be much higher and cost dramatically less.
We’ll talk about this more in detail in the “Law of Shitty Click-Throughs” section but even without factoring in the increase in customers you get from a great product, the difference is stark.
Now see what having a net negative churn of -2.5% does (where expansion revenue outstrips churn.)
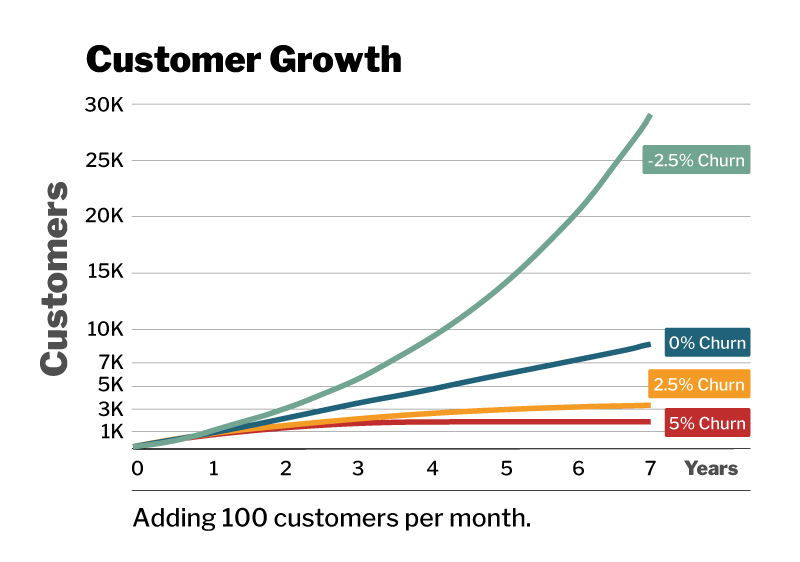
You could grow by no more than 100 customers a month and you would still have exponential growth.
That is the power of net negative churn. That is the power of compounding customer happiness.
The Law of Shitty Click-Throughs
Another reason why you need 50+20 revenue is to overcome what Andrew Chen calls “The Law of Shitty Click-Throughs.”
Unless you are really driving customer happiness to the point of generating a lot of word-of-mouth and brand (“I heard of you”) leads, the channels that appeared so successful while scaling to $10m will dry up.
Previously effective channels will cost more and convert at a lower rate, leading to exponential deterioration.
Sometimes I get asked “have you ever seen someone do XYZ to acquire customers?” Turns out, the highest vote of confidence I can give is, “No I haven’t, and that’s good – that means there’s a higher chance of it working…”
Andrew Chen
So why does this happen?
A few reasons:
- Customers respond to novelty, which fades over time and with use.
- Novel marketing channels get copied which drives away novelty.
- Scaling channels leads to less qualified customers, who need more education.
All [growth] channels [decay] over time…
Andrew Chen
Novelty
You see so many ads every day that you have developed an immunity to them. This phenomenon is called ad-blindness.
You see literally thousands of ads per week. A constant barrage of billboards, in-store advertisements, emails, texts, Facebook ads, Youtube ads, plugs for something in a blog post or podcast.
Yet most of us can’t recall more than 1 or 2 ads we saw last week.
Did you know that the first-ever banner ad had a clickthrough rate of 78%?
Customers respond to novelty. People notice and therefore respond when you communicate with them in novel ways because they have not developed the immunity known as ad-blindness to it yet.
Humans are an interesting paradox. Our brains are exceptionally good at detecting and then filtering out patterns yet we also crave novelty.
What do you do when your customers respond well to a growth channel? Well, you scale it up of course!
Scaling channels decreases their effectiveness because scaling:
- Arbitrages the novelty by saturating the market (so customers grow blind to it.)
- Arbitrages profitability by bidding up costs and inviting competition to do the same.
- Depletes the early adopters who are actively seeking your product and leaves the mainstream market that needs a lot more convincing.
All of this leads to “shitty click-throughs” as the law is named after. A lot of short-term growth channels start with high clickthrough rates and end much lower within a few months. The same thing happens to longer-term growth channels over time.
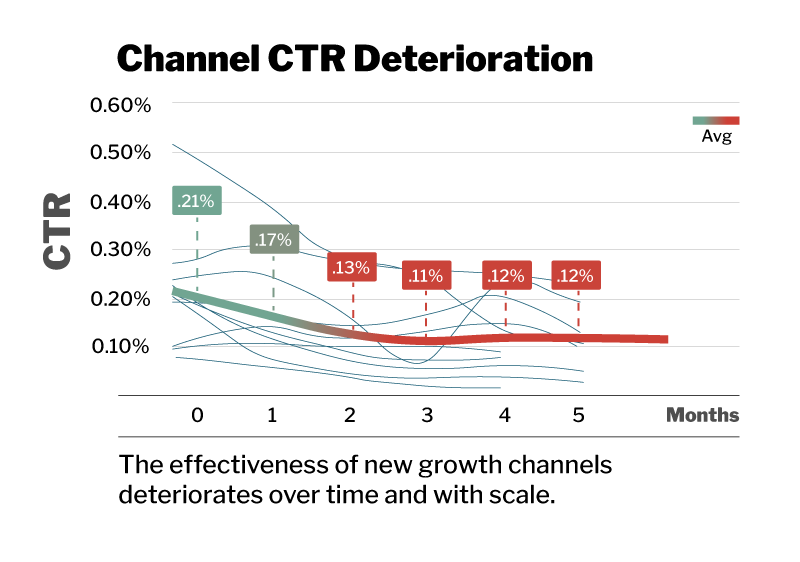
One of the side-effects of having 50+20 revenue is that, in addition to generating 70% of your revenue directly from your happy customer base, it also makes your paid channels scale better.
Growth channels, especially paid ones, need a positive brand reputation to scale effectively over time.
Once a growth channel scales and loses novelty, the only thing that will differentiate you is customers thinking “Oh I’ve heard of this product and I’ve heard it’s good.”
When you have a positive brand image, your click-through rates go up, your pricing goes down, and competitors can’t easily copy without investing deeply in their own product and reputation.
This is the only way you can grow current or new marketing channels at a very large scale for sustained periods of time.
Customer Happiness Solves Scaling At Scale
Customer happiness is a fluffy, subjective-sounding word but I hope you can see the very real impact it has on your growth curve.
It impacts the 3 categories of revenue at your disposal:
- Zero-cost leads.
- Paid leads.
- Expansion revenue.

It directly drives your zero-cost leads and unlike growth tactics that scale poorly on their own due to the law of shitty click-throughs, your zero-cost leads will continue to scale at the same rate as your customer base.
It also drives expansion revenue and drives down the cost of paid channels as you scale.
With all this extra revenue you can go profitable anytime you want or you can re-invest deeply in your product and compound customer happiness even further.
But without customer-happiness-led growth, things get tough.
But if you don’t hit 50/20 at $10m in ARR, best case, you’ll have a capital inefficient mess of a business. You’ll be super “Magic Number” sensitive. You’ll scrutinize every marketing program and every sales spend. Your sales team will feel like a cost center, not a profit center. You’ll hold back on those extra SDRs and AEs. You’ll have to run ever faster to keep up with your targeted growth.
And importantly — you may never go cash flow positive.
Jason Lempkin
How to Get to 50+20 Revenue
Ok, I hope I haven’t scared you away. It’s good to have a healthy fear of reality but it’s even better to get to the actionable takeaways. If your number isn’t great, that’s ok, I’m going to break down what you can do to get there.
Measure Your Customer-Stated Lead Sources
You won’t know how close you are to getting 50% of your revenue from word-of-mouth “I heard of you” leads if you aren’t tracking it.
You have to really get on top of this to track it effectively.
Just to be clear, this is not the “lead source” that is automatically generated when your analytics tool or CRM first sees a customer visit your website (i.e. we aren’t interested in knowing whether they clicked from Google or a Facebook ad in this use-case.)
The only way to really know how you are doing and progressing is to ask your customers during the sales process.
Track first, second and third touch.
Ask your customers during the sales process, before they forget (I didn’t pay my reps unless they logged the customer-stated lead source, and you couldn’t close the Opportunity without filling in this field).
Don’t allow any material amount of “Don’t Knows” as your lead source. No, the lead source is not “Intercom”. You need to know. Or you won’t really know how you are doing in terms of zero cost marketing.
Jason Lempkin
NPS and CSAT
[…] Focus like crazy on CSAT and NPS, at $1m ARR or even earlier. Measure it, raise it, make it happen. Even at just $5m ARR, it will almost be too late. And don’t be too confident if you are at say $1m and growing like a weed, but your NPS and CSAT are low
Jason Lempkin
For clarity let’s do a brief overview of what NPS and CSAT scores are. If you’re already familiar you can skip to the next section.
NPS
NPS, or “Net Promotor Score” surveys assess how loyal a customer is to your company.
NPS surveys ask the question:
“How likely is it that you would recommend our company/product/service to a friend or colleague?”
Customers give an answer from 0 to 10, 0 being “not likely” and 10 being “very likely.”
A follow-up question asking customers why they chose the score they chose is common.
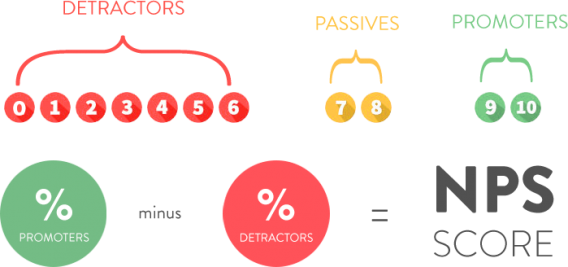
The responses get broken down into 3 segments:
- Promotors (9-10). These are your happiest and most loyal customers who want to shout your name from the rooftops.
- Passives (7-8). Passives are happy enough but not as likely to refer you to their friends.
- Detractors (0-6). Detractors are unhappy and can be dangerous for your brand, writing negative reviews, telling friends to avoid you, etc.
You calculate your NPS score by subtracting the percentage of Detractors from the percentage of Promotors.
CSAT
CSAT, or “Customer Satisfaction” surveys ask customers some variation of the question:
“How would you rate your overall satisfaction with our product?”
The responses typically answer on a scale of 1 to 5:
- Very unsatisfied
- Unsatisfied
- Neutral
- Satisfied
- Very satisfied
How to Use NPS and CSAT
Ok, this might be obvious but first you need to be tracking your NPS and/or CSAT scores. Be careful about how and when you trigger the survey request.
For example, asking a user whether they would recommend you 10 minutes after signing up is going to produce unreliable data. Or if you ask immediately after a customer service interaction it is more likely to reflect how well their issue was resolved than their overall happiness with the product.
NPS and CSAT are valuable customer experience tools. They’re simple and easy to use but they are only valuable to the extent that you act on them and follow up with additional qualitative and quantitative data.
I would especially be cautious about using survey scores as the only input into important decisions.
An example of a way to misuse survey data would be identifying who your net promotors are, identifying the features they most use and attempting to drive the same in-app behavior across your entire customer base.
High NPS or CSAT scores tend to correlate with high retention and growth but not always.
You are much better off using that data as a starting point to help you find the customers who have low churn and high engagement in your product analytics data. Perhaps do some qualitative research by calling low or high scoring customers and then base your decisions on that much larger and more complete picture.
Customer happiness scores should be used as a jumping off point and as a sign that your other efforts are paying off. Think of it more as a lagging indicator than a tool to identify specific cohorts to clone.
What’s a Good NPS or CSAT Score?
You ideally want a positive NPS score or CSAT scores with more “satisfied” or “very satisfied” responses than “unsatisfied” or “very unsatisfied” responses.
But ultimately this is a metric that is directionally useful. That is to say that it’s more important that your score is going up over time than anything else.
A good net promoter score to have is one that is higher than you had last quarter.
Adam Ramshaw
Track Product Adoption
In my mind, tracking and improving product adoption is the most actionable lever at your disposal for improving customer happiness and getting to 50+20 revenue.
It’s more than just a growth or product lever. It’s something that the entire company can align around improving.
Product adoption is the process of new users learning about, choosing and using your product more deeply and/or frequently over time.
Eric Keating
If you want to drive retention and LTV up you have to understand the intersection between the real-life problems you are solving for customers and the features and usage patterns that get them there.
Broad goals like revenue directionally don’t tell you where the leverage is in your growth model to achieve the result.
The answer is to create a measurement of product usage that tells you the success and happiness customers are finding within your product.
A well-instrumented product adoption metric will help contribute to both of your 50+20 numbers. It drives up:
- Retention.
- Expansion revenue.
- Customer happiness (word-of-mouth.)
Some call it a Product Adoption Score (or PAS), Hubspot calls it their Customer Happiness Index (CHI) but ultimately it’s about measuring customer success quantitatively based on their in-app behavior.
For example Hubspot’s CHI score awards points when customers blog regularly, track leads through Hubspot, or run effective marketing campaigns. It’s a mix of both engagement and successful outcomes.
How to Create Your Own Product Adoption Score
First off, you need to identify the behaviors and usage patterns within your product that correlate with retention and high engagement.
Start with your best customers. By best I mean the ones with high retention and high engagement. This should be done quantitatively. Don’t rely on contract value or NPS scores.
As we mentioned earlier, NPS is just one datapoint and a snapshot in time and is a bit too far removed from the source of what we want to directly improve (high LTV and lots of engagement.)
Some of your customers may be meaningfully different from each other and have different needs, use-cases, or feature usage. If that’s the case you may need to segment them into separate cohorts.
Second, look for the patterns.
- Which features are they using?
- How often do they log in?
- Anything that stands out is fair game.
Third, make sure you aren’t carrying any biases into the data. You want to be VERY careful about making changes to your product and customer behavior based on erroneous data.
Check for survivorship bias. Is a fixable issue causing high churn for certain cohorts?
Compare usage patterns against other active and churned customers to see if the correlations hold up. Eyeball it and do a regression analysis.
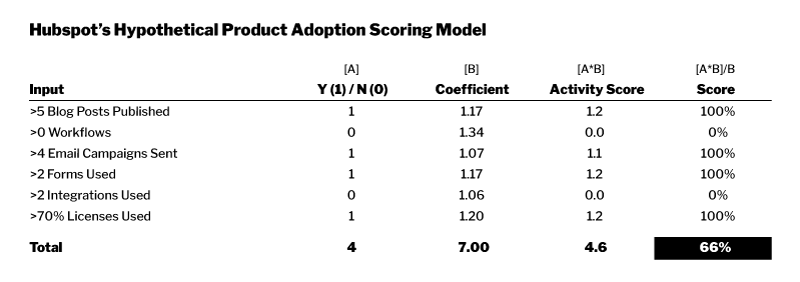
Once you have a set of features or behavioral patterns that correlate with retention you’ll want to weight each one according to their coefficient (the actual level of correlation with retention.) This way each individual feature or pattern contributes to the whole score according to its level of importance.
Using Hubspot as an example, behaviors or features you might track could include:
- Number of integrations used.
- Number of blog posts published.
- % of users who log in weekly.
- % of licenses utilized.
A well calibrated product adoption score can and should be used to create alignment across the entire org. It’s a map to driving customer success and happiness (aka it’s a map to getting to 50+20 revenue.)
But you can’t accomplish this with just one department. Done right, this impacts:
- What marketing should communicate from landing pages to emails.
- What sales reps should focus on during the sales process.
- What product features are emphasized, and developed, and how they are priced and packaged.
- What customer success can do with individual interactions as well as scalable education and training programs.
Hire More CSMs
More CSMs. Hire more customer success professionals on the way from $1m to $10m ARR. This can only help. Hire 50% more than plan. Make sure every customer has coverage. Make sure every single one of your top customers is visited every quarter, in person. No matter where they are.
Jason Lempkin
As more of a growth hacker, I’m going to approach this from a product-led lens. Having enough customer success coverage is essential but you should also be thinking about how to make their lives easier as a company.
If customers are churning because users don’t know how to use the product, consider what you can change to get users educated and using the product more than once within the first week and ultimately establish a pattern of usage.
You can accomplish this in many ways including:
- Charge a mandatory onboarding fee to train users.
- Create a ton of guides and content.
- Teach customers new use cases they may not have considered.
- Lead customers to success through nudges within the product.
Make sure that the entire customer journey is aligned toward the “aha moment” of your product experience. You need to align the customer’s experience and expectations across:
- Marketing pages.
- Sales presentations.
- Product and emphasized features.
- Customer success.
Each one of these steps needs to be consistent and congruent from one to the next or there will ultimately be a disconnect.
Happiness = Reality – Expectations.
Customer success can only help customers experience the “reality” portion of the equation more successfully. They can’t make the product to meet expectations that are not aligned with the product’s “aha moment” experience. The departments that engage with the customer journey prior to this point have much more influence on expectations.
Build Integrations
Build integrations for the tools your customers already love and use. Each integration your customers utilize is like another root that anchors you into their digital lives. It both increases happiness and switching costs.
It also has the effect of making it easier for the marketing and sales team to show customers how they can integrate your product into their existing processes.
Pandium cataloged the number of integrations each of the 1,000 fastest-growing SaaS companies have and found the median to be 15.
Additionally, they looked at the 15 largest SaaS companies and found the median number to be 347.
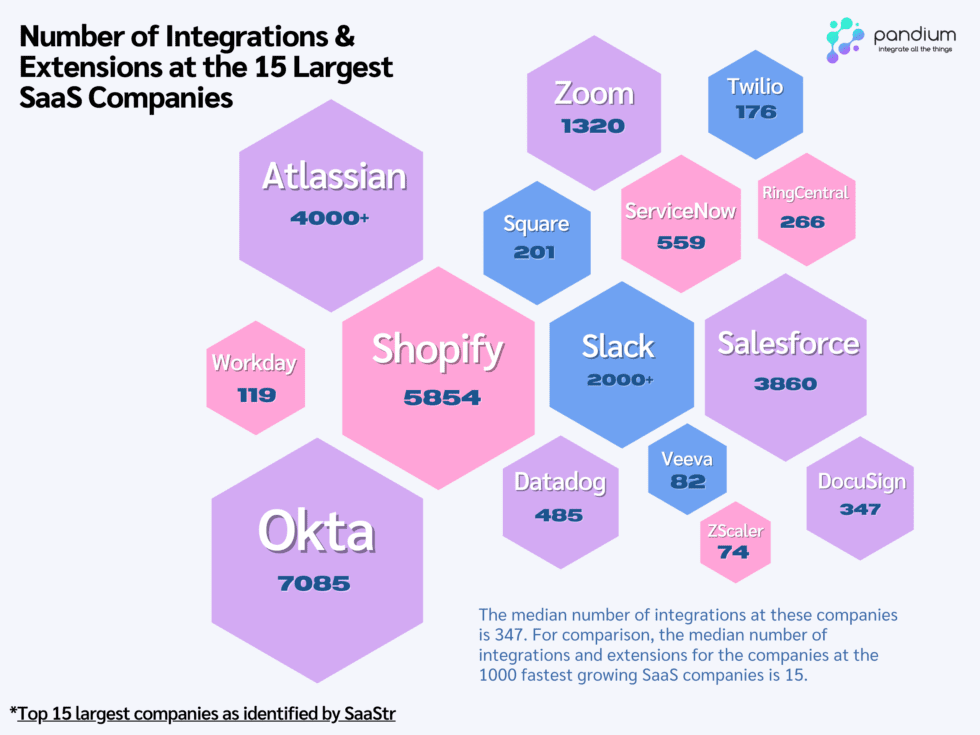
If you want to be a leader in your space, integrations are likely to be extremely important, especially as you scale past $10m.
Look specifically at your competitors. How many integrations do they have? Make a plan to seriously invest in your own API if that number is higher than your own.


